-
CPLUG Research Report No 1: An analysis
of the decline in library funding and its impact on the service.
1.IntroductionIn the CPLUG (Camden Public Libraries Users Group) document "Views
from the Users Group", it was found that there was a sufficient lack
of financial data available in the borough archives to severely limit
the quantitative analysis that could be presented. Since the publication
in July 1998 of the CPLUG study, more information has now been provided
by Camden's finance department and library performance research has commenced.This report has been written to amplify the information contained in the
original CPLUG document and to enhance the publicly available data base
on which informed discussion of the future direction of Camden's library
service depends. It is intended that it will be the first of a continuing series.2.The Effect of Expenditure on Library Performance
Although libraries have many functions, probably their most important
activity is that of book lending. An analysis of this aspect of
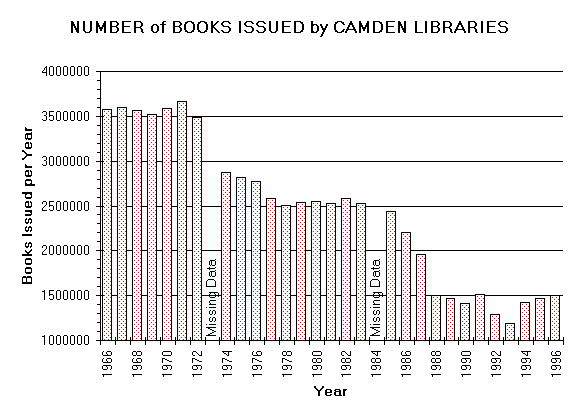
Camden's library service chart 1 has shown that the first few
years of Camden's existence was marked by a very consistent lending
performance. Up to 1971 book issues varied between 3.5 million and
3.7 million books per year. However, since 1971 this performance has
exhibited a continual decline that has been reversed only occasionally.
It is to be expected that there is some relationship between the amount
of money invested in Camden's libraries and the performance of those
libraries. To provide a realistic base for the examination of this
relationship, it is necessary to inflation adjust any financial data
that is used. In the CPLUG study and a Loughborough University report
on the Camden Library Service, the retail price index (r.p.i.) was used
to obtain this adjustment. For the limited duration covered by those
documents, the use of the r.p.i. does not cause great inaccuracies in
the resultant data. However, over the 31 years covered by chart 1, a
more representative index would need to be used to conserve accuracy. It
is possible to construct such an index from published government
statistics, but it does not appear to exist at present. As a result of
the enforced use of the r.p.i, it is therefore necessary to restrict
the period for which financial data is utilized.
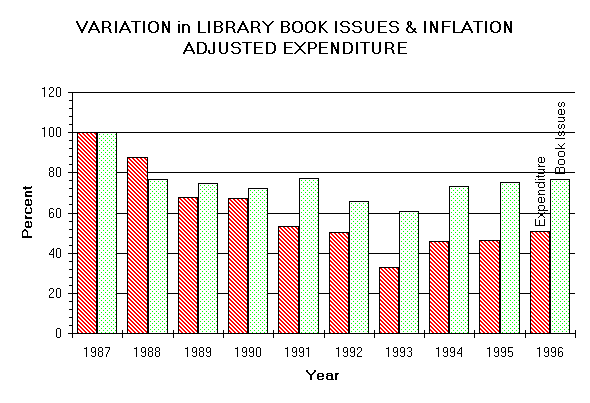
A medium term comparison of the variation in library book issues and
inflation adjusted expenditure is given in chart 2 From this, it is
clear that there is a good positive correlation between the two sets
of data. The degree of matching between the two sets can be determined
by calculating the correlation coefficient. This coefficient can have
a value ranging from zero to +/-1. A value of +/-1 will be obtained for
perfect matching.

For the data given in chart 2, the correlation coefficient is 0.793.
This is a very good correlation and implies that expenditure is the most
important factor in determining the magnitude of library book issues.
Other factors, such as library management procedures and external changes,
must have a significantly smaller effect.3.Camden Council Commitment to the Library Service
All local councils claim to be in favour of a vigorous, successful library
service. Unfortunately, some councils fail to recognize that such a
service can only obtained if the council provides active support for it.
In order to determine the level of commitment of Camden Council to the
Library Service, an investigation was carried out to determine the
proportion of the council's income that was allocated to libraries.
For the purposes of the analysis, Camden Council income has been
defined as the total income from grants and taxes as given in the Camden
Council Consolidated Revenue Account. No inflation adjustment is
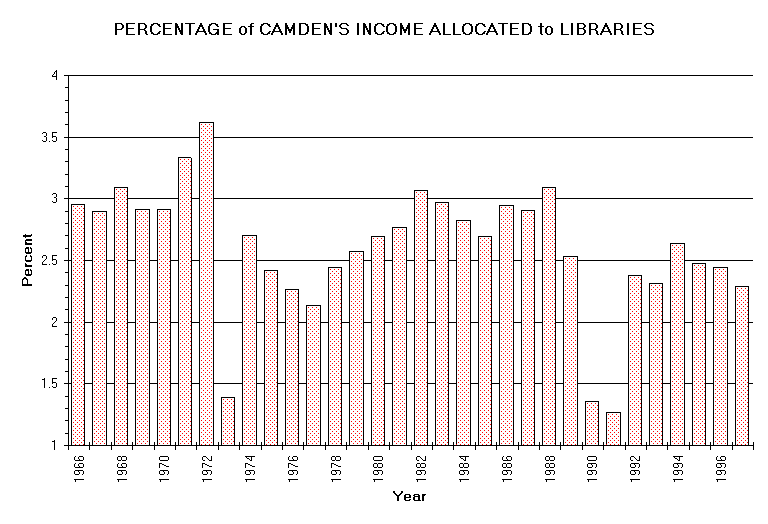
necessary as the derived values are essentially ratios.Chart 3 shows a 32 year history of the allocation of Camden Council
revenue resources to the Library Service. Up to 1971, there appears
to have been a consistent policy of allocating approximately 3%
of council income to library use. After this initial period, no
obvious consistency is discernible.

The post 1971 library allocations are characterized by the wide
swings that are usually associated with departments of organisations
which are considered to be of low priority The budgets of these
departments are frequently raided to provide funds for more highly
favoured departments. Occasionally, attempts are made to repair the
damage to the department that has occurred due to underfunding and
the inability of departmental management to carry out any long term
plans. These departments are sometimes called orphan departments, as
they lack parents i.e. supporters among the senior management of the
organisation.Of course, there may be other explanations for the facts presented in
chart 3. However, that explanation will have to take account of the
obvious change in policy which occurred in 1971 i.e. the change in policy
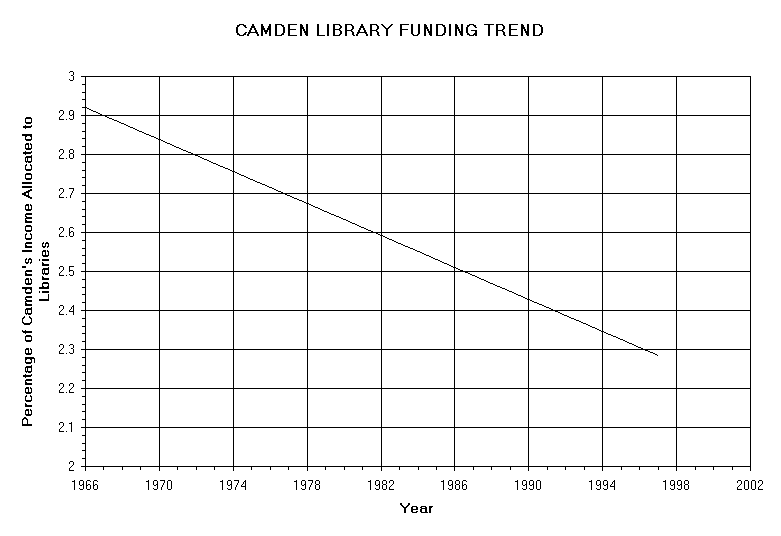
that occurred when political control of Camden Council changed.Although chart 3 is dominated by wide variations in library allocations,
there is some evidence for a long term trend existing within the data.
To isolate this trend, a linear regression analysis was performed. This
type of analysis produces a best fit straight line through a data set.
With a confidence level of 95% the trend given in chart 4 is that for
the proportion of Camden Council allocated to the Library Service over
the 32 year period.

The equation for the trend is:
% of Camden Council income
allocated to library use in year X    = 43.314 - 0.0205453X
This represents a gentle but relentless decline in Camden's support for
its libraries and, inevitably, has a cumulative negative effect on the
quality of that service.Prepared by A. Templeton 28th December 1998.